
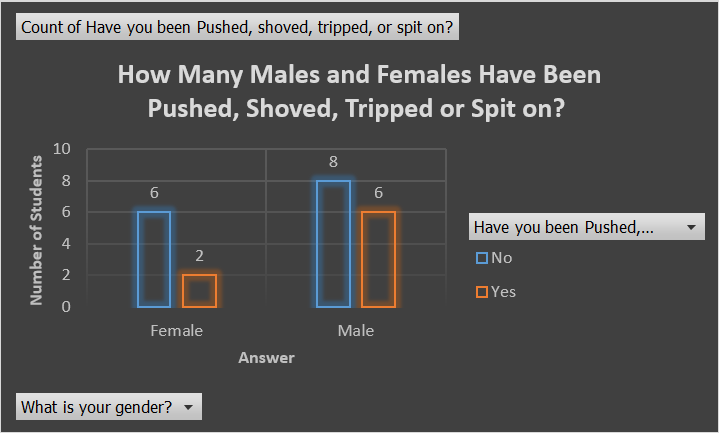
This graph shows how many males and females have been pushed, shoved, tripped or spit on, on purpose. 6 females have not been pushed, shoved, tripped or spit on but 2 have. 8 males have not been pushed, shoved, tripped or spit on but 6 have. The difference in numbers is caused by 2 reasons. Firstly, there are more males than females so that means that there’s a higher chance for more males to be bullied than females. The second reason is that statistically males are more likely to bully than females and most males won’t physically bully females. There are a total of 14 people who have not been spit on and 8 people who have. This graph may be incorrect because some people might not want to admit that they’ve been pushed, shoved, tripped or spit on.
